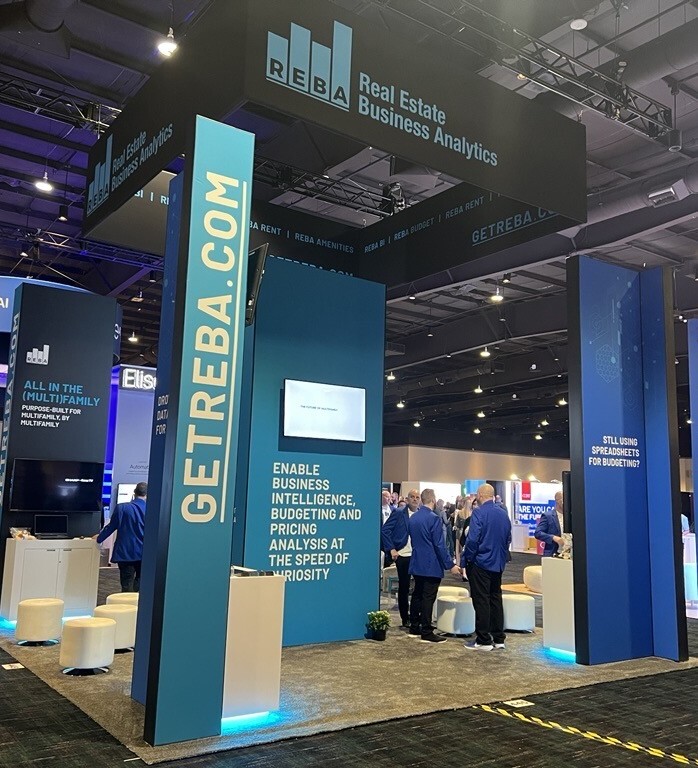
If you’ve ever felt like you were drowning in data yet struggling to get insights you can act on, you know exactly what I’m talking about when I refer to data pain. The harsh reality is that we spend much more time collecting and collating data than we do actually analyzing that data. We’re downloading reports, copying and pasting them into Excel, or bouncing from one report to another because the data we need doesn’t exist in a single report.
Imagine if for a moment we could flip that script. Instead of living in a “data-rich actionable insights poor” environment, we could be in a place where meaningful multifamily real estate insights are right at our fingertips, and we spend mere seconds or minutes getting to what we need, leaving so much more time for analysis and direct action.
So why is this important in rental housing?
Well, we’ve all experienced the dramatic increase in proptech capabilities. We’re using more different pieces of technology than years ago, and the tech we have continues to increase in capability thus creating more data for us to have to find and search and understand.
Pulling and analyzing data from multiple sources is difficult and time-consuming. So, at best it takes us much longer than we would like, and at worst, we simply don’t do the analysis because it’s so hard to do it’s just not worth doing. Which ends up with us making decisions based more on intuition rather than data.
Obtain a competitive edge with our Multifamily BI tool
If we could centralize all that data from all those data sources into one single source of truth, we could more easily find exactly what we need enabling us to make those better decisions, faster. You could then format data, reports, and dashboards - however many you’d like in any way you want - to outperform on the 4 Critical Success Factors (CSF) all rental housing companies share:
- Maximize rental revenue
- Proactively manage expenses
- Effectively convert leads to leases
- Provide great customer service
Since our data model is built around these CSFs it drives actionability, not just information, and helps create and sustain an analytically driven culture.
Data Gain Dashboards
Here are 3 dashboards that we know drive data gain impact with our clients and are a great addition to rental housing companies’ revenue-driving toolkit:
- Marketing Dashboard – We have created a variety of marketing dashboards (Funnel Report, High Marketing Priority, Marketing Costs, etc.) to help marketers drill down into performance opportunities instead of immediately increasing Marketing spend to solve occupancy gaps.
- Engrain Dashboard – The Unit Map integration allows REBA BI clients to spatially visualize current and historical property data at the most granular level and gain contextual insights that are not available using a traditional spreadsheet or chart view.
- Renewal Negotiation Dashboard - This dashboard co-mingles data from different sources so that Community Managers can see all the variables that might play into a resident’s decision to renew their lease. We make all of the data available to help answer any question that a resident might raise during a renewal discussion and empower managers to know their entire lease story within minutes.
Simplify your life with our Multifamily Budget Tool
If you're feeling this pain, or if you know your team could be working more efficiently when it comes to business decision-making, there is a better way. Your business intelligence journey doesn't have to be complicated. Start small, start simple, but start now. Data gains are right around the corner and we're here to support you.
Featured image by Uladzimir Zuyeu on iStock.


.jpg)
.jpg)
SHARE