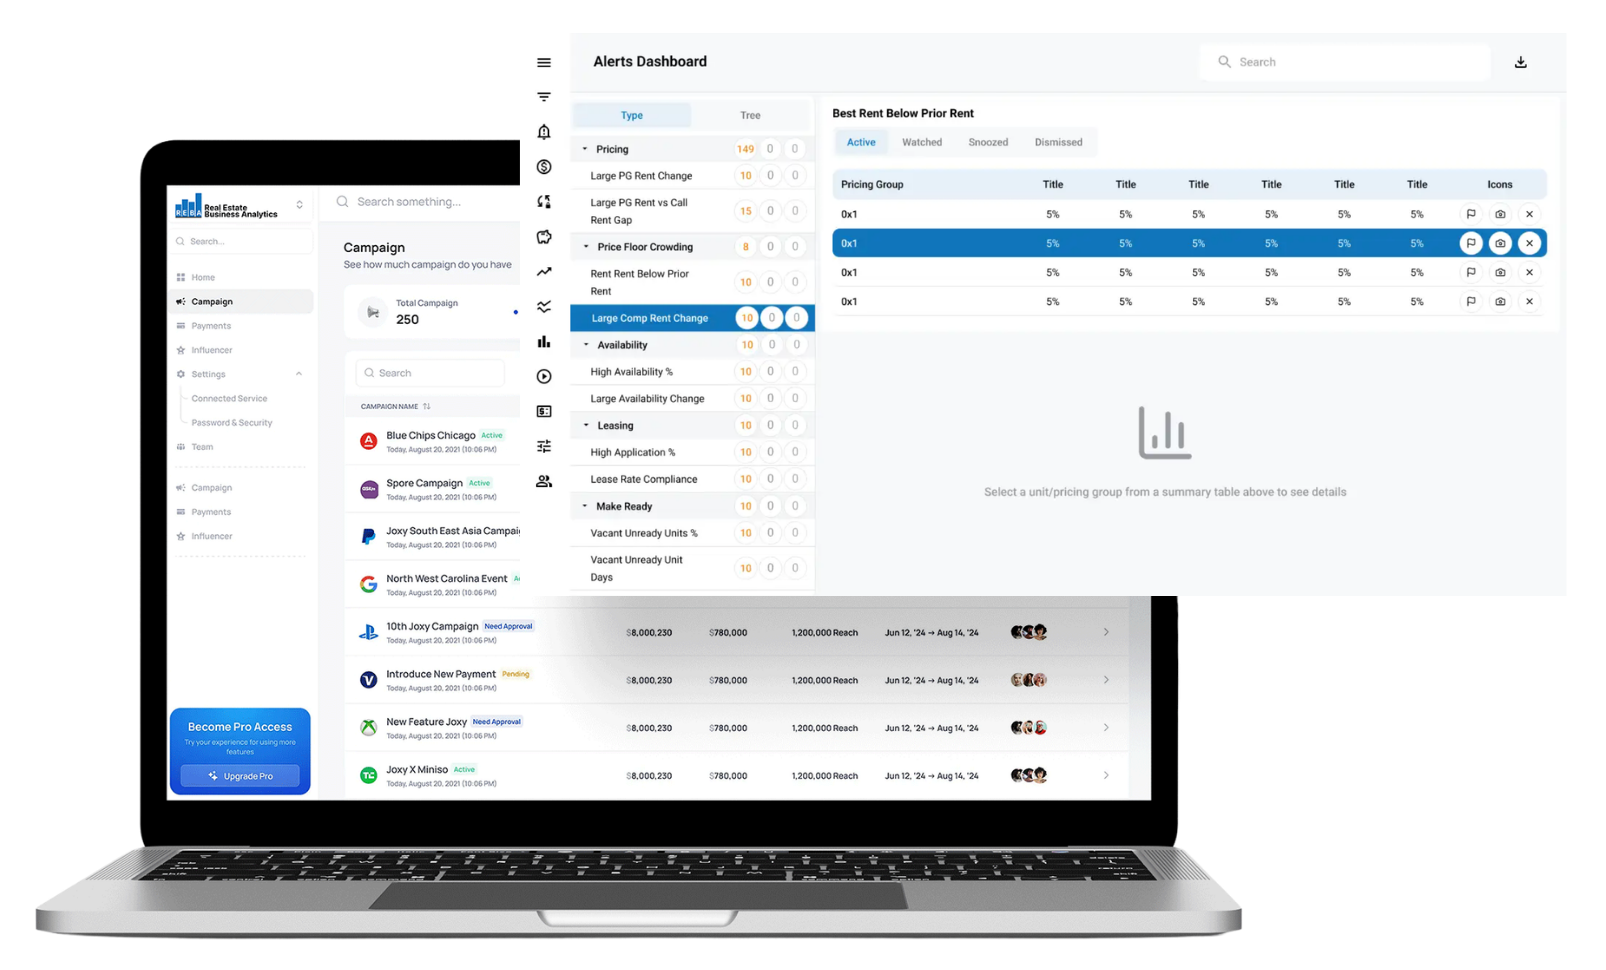
See Your Market Clearly
Stop hunting for market data. REBA Market Explorer gives you daily-updated insights on 30+ million multifamily units and the market trends that matter most.
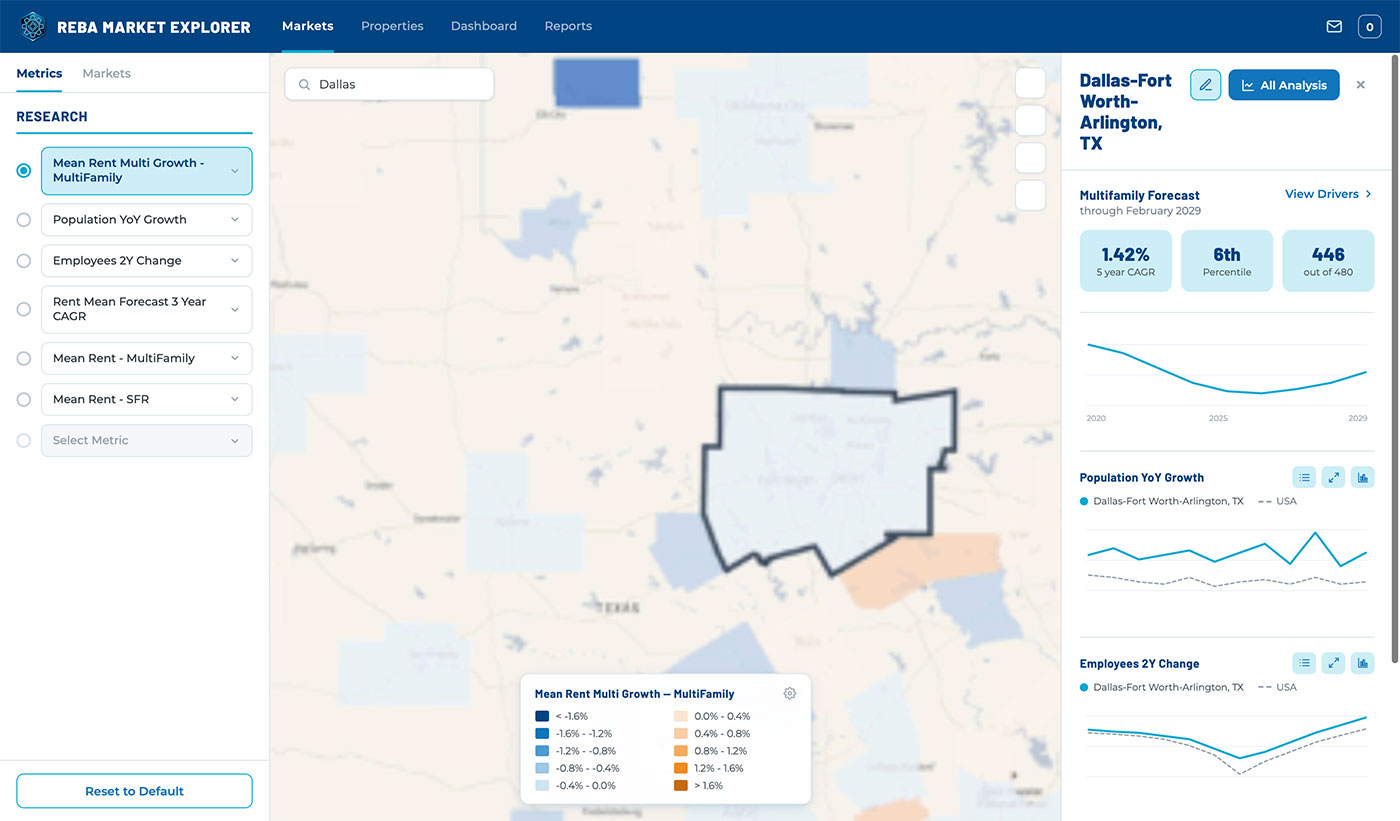
Real-Time Data Behind Real Decisions
REBA Market Explorer is built to handle the realities of today’s rental market, providing scale, accuracy and updates needed to make better decisions, faster.
Coverage That Matches the Market
REBA Market Explorer tracks roughly 3 million properties and 30+ million units, built on one of the largest independent rental datasets in the country.
Cleaned to Institutional Standard
Data is cleansed and standardized before it reaches you, so you’re building strategy on numbers you can stand behind, not raw feeds you have to clean yourself.
Refreshed Daily, Not Quarterly
Submarket conditions shift fast. A daily refresh means your read on the market reflects what’s happening now, not what happened last quarter.
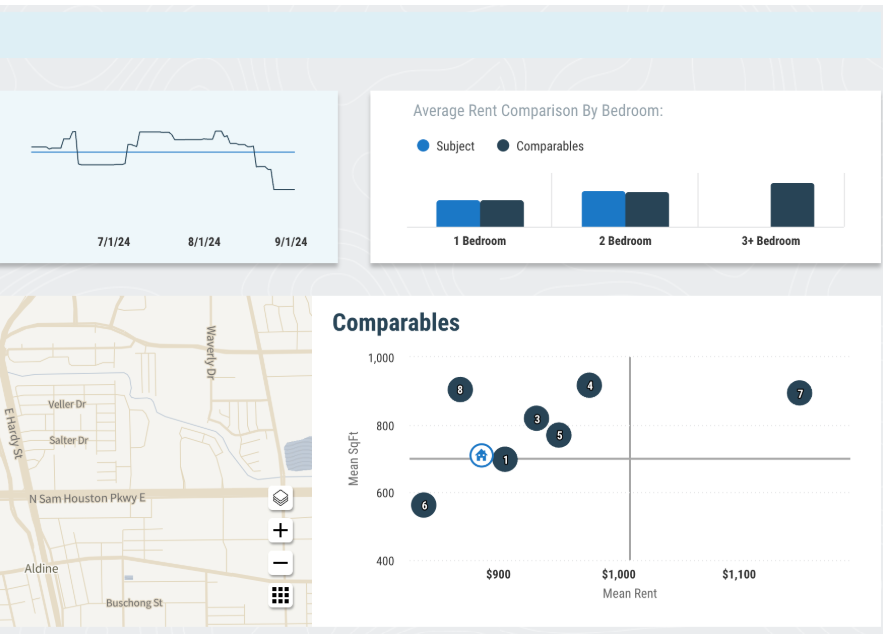
REBA Clients Know
Strengthened Investment Decisions
Christian Evans, Investment Associate at The Dinerstein Companies.
“REBA’s AI-driven approach to rent forecasting has been a game-changer for our investment strategies.”


Lessons From 20 Years of Multifamily PRM
Learn the challenges of legacy PRM systems, what modern solutions look like & how to evaluate a new platform.

Faster Gains and Smarter Pricing with REBA Rent
REBA Rent delivered stronger rent growth, faster early leasing velocity, and sustained rent per unit gains, demonstrating the value of more responsive, data driven pricing.

20 Questions to Ask Your PRM Solution
Be sure to ask these 20 questions when evaluating a new multifamily revenue management software.
Ready to See Your Markets Clearly?
Get a submarket-level read on the market you can actually trust, refreshed daily and built for how multifamily really works.